Food prices rise the most in a year… Burden on low-income households increases
Last month, the prices of food and non-alcoholic beverages rose by the largest margin in a year, deepening the difficulties for low-income households.
According to data released by the National Statistical Office’s National Statistics Portal (KOSIS) on the 11th, the food and non-alcoholic beverage price index for July was 125.75 (2020=100), marking a 3.5% increase compared to the same month last year.
This figure significantly exceeds the overall consumer price inflation rate of 2.1% and represents the highest rate of increase since July of last year (3.6%).
The price increase rate of food and non-alcoholic beverages maintained a range of 2.0% to 3.0% from the end of last year until May of this year, before rising to the mid-3% range for two consecutive months recently. This upward trend is attributed to extreme weather conditions such as ongoing heatwaves and heavy rainfall, as well as increases in the prices of processed food.
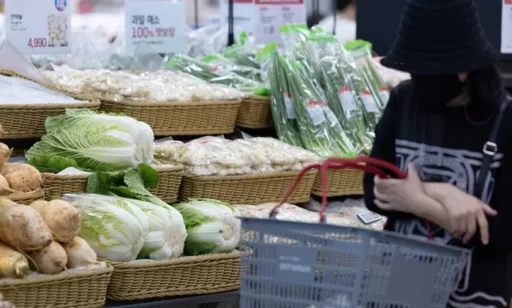
Price increase status and household burden by item
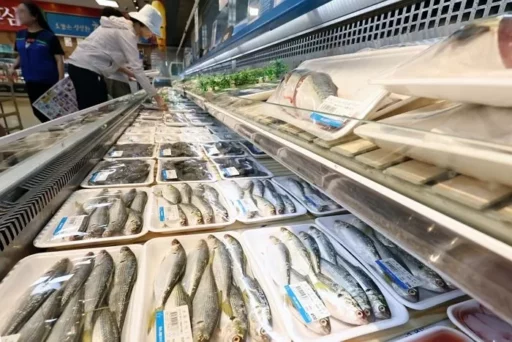
Among food items, fish and seafood prices saw the highest increase at 7.2%. This marks a continuous high level of over 7% for two consecutive months, reaching the highest point in two years since July 2023 (7.5%).
In particular, the prices of frequently consumed items like shredded squid (42.9%), yellow corvina (13.4%), and mackerel (12.6%) have shown double-digit increases, adding to the financial burden on households.
Bread and grain prices also rose by 6.6%, marking the largest increase in 1 year and 10 months since September 2023 (6.9%).
The staple food rice price increased by 7.6%, indicating a return to the 7% range for the first time in 1 year and 4 months since March 2024 (7.7%), while the price of instant noodles rose by 6.5%, maintaining a 6% increase for three consecutive months.
Additionally, prices for snacks, ice creams, and sugary foods (5.0%), other food items (4.7%), and milk, cheese, and eggs (3.6%) have also risen significantly.
Among non-alcoholic beverages, coffee, tea, and cocoa (13.5%), as well as bottled water, soft drinks, fruit juices, and vegetable juices (3.4%) had relatively larger price increases.
Public service price increases lead to rising living costs
Alongside the rise in food prices, public service prices, including public transportation fares, have also increased, further amplifying the financial burden on households.
The increase rate of public service prices had exhibited a stable trend of "under 1%" from October last year to February this year, but rose to 1.4% in March.
Since then, the increase rate slightly decreased to 1.3%, 1.3%, and 1.2%, before expanding again to 1.4% in July.

In particular, a significant factor was the basic fare increase of 150 won (from 1400 won to 1550 won) for the subway in the metropolitan area, leading to a 7.0% rise in urban railroad prices.
As the round-trip transportation cost for commuting by subway exceeds 3,000 won a day, the ongoing fixed living expenses are increasing. Should the government review potential price hikes for electricity, gas, and railways in the latter half of the year, the burden on households is expected to expand further.
For reference, the government's policy was to freeze public utility prices managed by central government departments during the first half of the year.
Professor Kim Sang-bong from the Department of Economics at Hansung University stated, "With prices already having risen due to the COVID-19 pandemic, the recent hikes in prices directly affecting daily life, such as those for food and transportation, have made life tougher for low-income households. It is time to look comprehensively at domestic distribution networks and global supply chain factors driving the price increases."
Image source: News1