Entering an Era of 10 Million Elderly Population in South Korea Amid Accelerating Population Structure Changes
As low birth rates and aging trends deepen, the number of elderly individuals aged 65 and older in South Korea surpassed 10 million for the first time last year.
This figure represents about 20% of the total population, indicating that one in five South Koreans is now an elderly person.
According to the '2024 Population and Housing Census Results' released by the National Statistical Office on the 29th, the total population of South Korea was recorded at 51,806,000 as of November 1 last year, an increase of 31,000 (0.1%) compared to the previous year.
The total population has decreased for two consecutive years since 2021, but it turned to an upward trend again starting in 2023. However, the rate of increase has shrunk further compared to the previous year (0.2%), reflecting a state of population stagnation.
A significant point is the contrasting trends between the domestic and foreign populations.
The domestic population decreased by 77,000 (-0.2%) to 49,763,000, while the foreign population increased by 108,000 (5.6%) to 2,043,000.
The foreign population had decreased for two consecutive years since 2020 but began to increase again from 2022, exceeding 2 million for the first time last year. This increase in the foreign population is analyzed to act as a buffer preventing an overall decline in the total population.
Changes in Age Structure and Increase in Old-Age Dependency Ratio
Examining the age-specific population changes, the working-age population (ages 15-64) decreased by 283,000 to 36,263,000, and the youth population (ages 0-14) fell by 199,000 to 5,421,000.
In contrast, the elderly population (65 and older) increased by 513,000 to 10,122,000, surpassing 10 million for the first time.
The proportion of the elderly population rose from 18.6% to 19.5%, and the median age recorded 46.2 years, an increase of 0.6 years compared to the previous year.
The median age refers to the age of the person who is in the middle when all individuals are arranged in order of age.
The aging index (the number of elderly people per 100 youth) increased to 186.7, which is 64.4 higher than in 2019 (122.3). Additionally, the old-age dependency ratio, representing the number of elderly individuals that must be supported per 100 working-age individuals, was 27.9, an increase of 1.6 from the previous year.
This indicates that the burden of elderly support is continuously increasing for the younger generation.
Meanwhile, looking at the distribution of foreign populations by nationality, the largest group was Chinese (Korean descent) at 538,000 (26.3%), followed by Vietnam (285,000; 14.0%) and China (223,000; 10.9%). The nationality that increased the most compared to the previous year was Vietnam, which saw an increase of 38,000.
Concentration of Population in the Capital Region and Changes in Household Structure
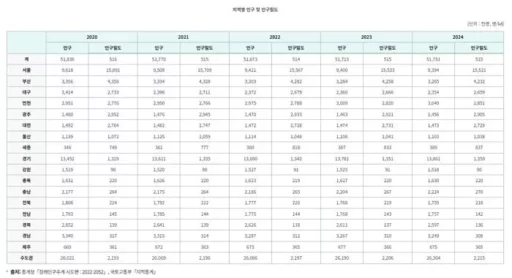
Examining the population distribution by region, the population in the capital region was 26,308,000, accounting for 50.8% of the total population.
Since recording a population proportion of 50.0% in 2019, the capital region’s population ratio has steadily increased each year, indicating a deepening concentration in this area.
By province, Gyeonggi-do had the highest population at 13,914,000, followed by Seoul (9,335,000), Gyeongsangnam-do (3,264,000), and Busan (3,257,000). Notably, the special and metropolitan cities of Seoul, Busan, Gwangju, Daejeon, and Ulsan have shown a continuous trend of population decline over the past five years.
Seoul recorded the highest youth population ratio (8.6%), while Jeolla-namdo had the lowest proportion of the working-age population (63.7%), and Sejong had the lowest percentage of elderly population (11.1%).
There were also changes in household structure.
The total number of households was recorded at 22,997,000, an increase of 1.2% (269,000 households) compared to the previous year.
Of these, single-person households accounted for 804,500, or 36.1% of the total, which is an increase of 21,600 households (2.8%) compared to the previous year.

Conversely, kinship households decreased by 3,000 (-0.2%) to 13,669,000, while non-kinship households increased by 35,000 (6.5%) to 580,000.
Among domestic residents aged 18 and older (43,065,000), the unmarried population was 12,736,000 (29.6%), the married population was 24,308,000 (56.4%), and the widowed or divorced population was 602,000 (14.0%). The unmarried population increased by 61,000 compared to the previous year, while the married population decreased by 13,000.
The unmarried rate by age group was highest at 96.0% for those under 20, followed by 53.4% for those in their 30s and 21.0% for those in their 40s.
This population and housing census was conducted using various administrative data sources, including the resident registration database, foreign registration database, and building register, based on 0:00 on November 1 of last year.
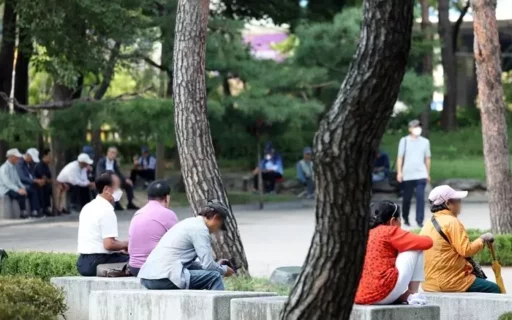
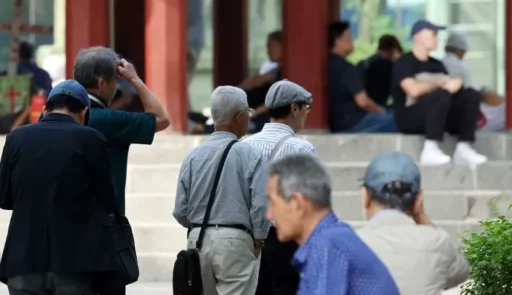
Image Source: Elderly people are resting in a park in Seoul. / News1, e-Nara Index website, News1